How to find what I'm looking for
1. How do I find the retention rate/graduation rate for a particular cohort of students?
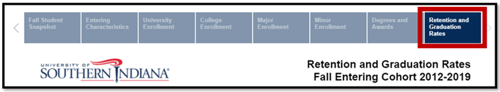
The Retention and Graduation Rates dashboard represents the percent of new, first-time undergraduate students who were retained and graduated. Only fall cohorts are represented, and transfer students are excluded. The chart contains eight years of data, so retainment rates to the 6th year may be examined.
- Click on Student Dashboards in the top navigation bar.
- Click on Retention & Graduation Rates title in the blue sub-header.
- Use any of the filters to identify your cohort. Note that the filters selected indicate the characteristics at the time of entry.
- The data in the chart will update based on your filter specifications.
2. How do I find the enrollment number for a particular college/department?
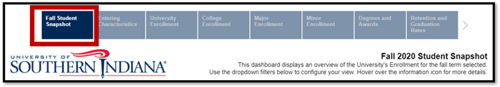
The Fall Student Snapshot represents the enrollment and demographics information about the overall USI student population. The report shows the total enrollment numbers for the past ten fall terms and can be filtered by fall term, college, department, major, and several demographic variables (by selecting the variable within the dashboard i.e. male, female, freshman, sophomore etc.)
- Click on Student Dashboards in the top navigation bar.
- Click on Fall Student Snapshot title in the blue sub-header.
- Choose how you would like the data aggregated. You can aggregate by fall term, college, and department by using the filters on the dashboard. This dashboard has built-in filtering capability, where users may click on any data element and all visualizations and tables in the dashboard will filter to those records. This enables users to drill down and explore the data on groups of interest.
- It is possible to make multiple selections, both within and across demographic variables (e.g., Undergraduate African American and Hispanic students). Click the demographic group you want to filter to; you may also select multiple categories within the same demographic. To select additional categories hold control while selecting each additional category. To undo a selection, just click it again with your cursor or return to the default visualization by clicking the reset icon.
- The data in the table will update based on your filter specifications.
3. How do I find basic student demographics for a particular department/major?
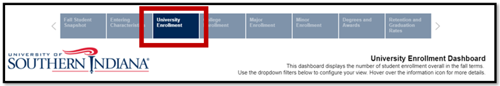
The University Enrollment dashboard represents the enrollment and demographics information about the overall USI student population. This dashboard is best used to find aggregate numbers of demographics by college, department, or major. The graph and table shows the total enrollment numbers for the past five years (can be filtered to 'Fall 2011-Fall 2015' by selecting it in the Fall Terms filter) and can be filtered by college, department, major, and several demographic variables (by using the Demographic Breakout filter).
- Click on Student Dashboards in the top navigation bar.
- Click on University Enrollment title in the blue sub-header.
- Use the top filters to identify your cohort (the Demographic Breakout filter will determine what the headings for the graph and table depict).
- The data in the table and graph will update based on your filter specifications.
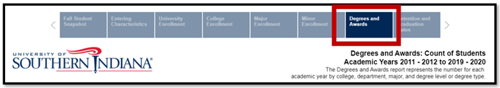
4. How do I find the number of yearly awards given for a particular college/department?
The Degree and Awards dashboard represents the count of students (the individual count of the number of students that completed a major/program) the count of awards (the total number of degrees awarded within majors/programs) and the count of major completions (the total number of majors/programs that have been completed) by college, department, major, and degree type or degree program of USI alumni.
- Click on Student Dashboards in the top navigation bar.
- Click on Degrees and Awards title in the blue sub-header.
- Use the top filters to identify your cohort.
- Use the Award Category filter to display either degree type or degree program in the table.
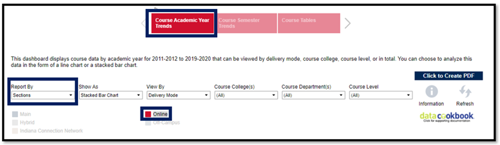
5. How many course sections were taught online in a particular term/year?
The Course Academic Year Trends dashboard represents course data by academic year from 2011-forward that can be viewed by delivery mode, course college, course level, or in total. You may choose to analyze this data in the form of a line chart or a stacked bar chart.
- Click on Course Dashboards in the top navigation bar.
- Click on Course Academic Year Trends in the red sub-header.
- Select Sections from the Report By filter.
- Click on the Online item breakout in the color legend.
- The highlighted areas are the amount of sections taught online for each academic year.
- (perform the last three steps on the Course Semester Trends Dashboard for the same data by each fall/spring/summer term).
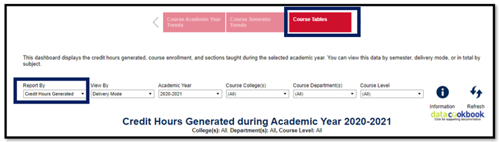
6. How many credit hours were generated by course subject/department/college in a particular term/year?
The Course Tables dashboard represents the credit hours generated, course enrollment, and sections taught during the selected academic year. You may view this data by semester, delivery mode, or in total by subject.
- Click on Course Dashboards in the top navigation bar.
- Click on Course Tables in the red sub-header.
- Select Credit Hours Generated from the Report By filter.
- Use the View By filter to determine your breakout of either semester, delivery mode, or subject.
- Use the top filters to select colleges, departments, and academic year.
7. How can I tell if the number of full-time faculty members has increased in my department?
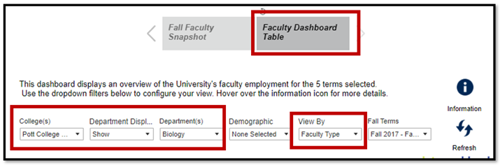
The Faculty Dashboard Table dashboard represents an overview of the university's faculty employment for the 5 terms selected.
- Click on Faculty Dashboards in the top navigation bar.
- Click on Faculty Dashboard Table in the gray sub-header.
- Select a college from the College(s) filter.
- Select Show from the Department Display filter.
- Select a department from the Department(s) filter.
- Select Faculty Type from the View By filter.
- The table below will then display the number of full-time faculty members within the department for the 5 terms selected from the Fall Terms filter.