The University of Southern Indiana Factbook contains institutional data regarding students, faculty and courses. It is an interactive document, so you may examine the data in ways not previously possible with a static document. The Factbook is powered by Tableau, a data visualization tool. If you have not used Tableau before, here is some information for navigating the USI Factbook and examining the data within it.
Redesigned Factbook Overview
- The redesigned Factbook (as of Fall 2020) now contains data going back to Fall 2011. You can filter between the most recent five fall terms and the previous five fall terms by using the "Fall Terms" filter on the dashboards that display them.
- Previous year's Factbooks will be no longer available beginning in 2021.
Navigating the Factbook
The Factbook is organized into 3 sections (Tableau Stories):
- Student Dashboards
- Fall Student Snapshot
- Entering Characteristics
- University Enrollment
- College Enrollment
- Major Enrollment
- Minor Enrollment
- Degrees and Awards
- Retention and Graduation
- Course Dashboards
- Course Academic Year Trends
- Course Semester Trends
- Course Tables
- Faculty
- Fall Faculty Snapshot
- Faculty Dashboard Table
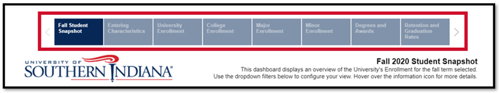
You can switch between Tableau Stories (student, course, and faculty), by clicking on the headers.
These three Tableau Stories allow for multiple dashboards to be presented conveniently in one area by subject (student, course, and faculty). To toggle between the dashboards available within each Tableau Story, select the title in the blue sub-header to switch to that dashboard.
 Filtering Data
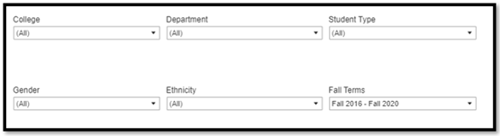
Most of the dashboards in the Factbook have several filters that can be used to narrow down the scope of the data. The filters are arranged across the top of each dashboard. You may use several filters at the same time to fine tune the data, but you may need to give Tableau a few moments to respond to each filter you set. When you are done filtering, your data will be displayed in the visualizations/tables below.
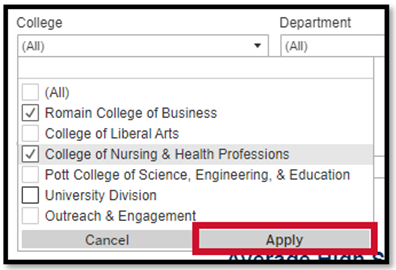
Multiple-Select Filters will allow you to select more than one option from one filter. These are equipped with an "Apply" feature at the bottom. Perform your selections in the filter, and then select "Apply" to view the changes in the dashboard.
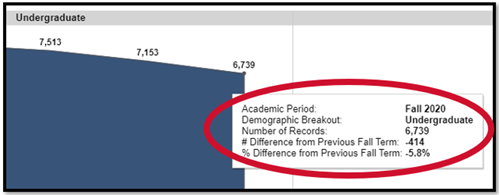
Using Tooltips
Every dashboard contains tooltips. Some tooltips will provide additional information that is not included in the chart or the graph. Hover your mouse over the number in the visualization and the tooltip will pop up. When you move your mouse away, the tooltip will disappear.
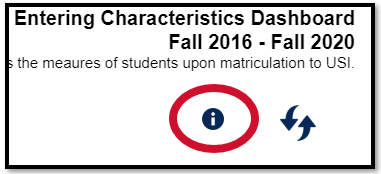
Using the Information Button
Each dashboard has an information button located in the top right hand corner of the dashboard next to the filters section. When you hover over the information button, additional information about the dashboard will pop up. When you move your mouse away, the pop up will disappear.
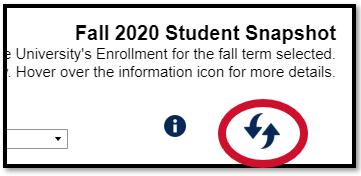
Using the Refresh Button
Each Factbook dashboard has a refresh button to make it easier to reset your filters back to their default settings. Click on the refresh button and your filters will reset and the dashboard will revert to its default state.